
Phase Envelope Diagrams and Isometric Lines (Quality Lines)
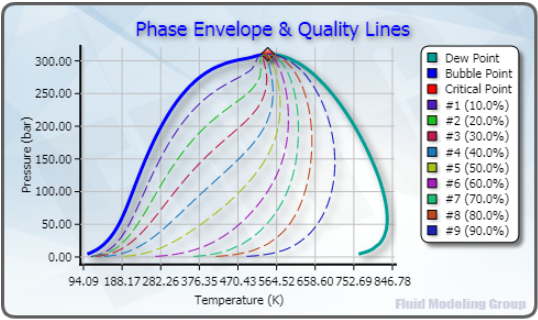
On a P-T diagram of a multicomponent mixture, it shows a temperature and pressure region usually encircled by a curve known as phase envelope. The closed area co-exists two phases. The phase envelope usually consists of a bubble point curve, a dew point curve and a critical point.
In the two-phase region on the P-T diagram, a curve graphing temperature against pressure on which the volume of the mixture remains constant is called isochore or isometric line. For reservoir engineers, the phase envelope and isochore provides essential information to further understand the reservoir fluid properties and make strategic plan on reservoir production.
Technically, the phase envelope may be obtained through a series of bubble point and dew point calculations. It is, however, time consuming and sometime causes a non-converging issue. In this module of the cloud computing, the method established by Michael L. Michelsen (1980) is adopted for the calculations of phase envelope and isometric lines.
There are twelve (12) equations of state available for selection combined with the certain mixing rules:
- Soave-Redlich-Kwong (SRK), 1972
- Peng-Robinson (PR), 1978
- Peng-Robinson (PR), 1976
- Peng-Robinson (Magoulas & Tassios revision), 1990
- Adachi-Lu-Sugie (ALS), 1983
- Patel-Teja, 1982
- Valderrama-Patel-Teja, 1990
- Schmidt-Wenzel, 1980
- Yu-Lu, 1987
- Modified Du-Guo, 1989
- Trebble-Bishnoi, 1987
- Salim Modified Trebble-Bishnoi, 1994